
Tutorial for Brownie Bee
Here you find a brief introduction of how the Brownie Bee app is used for optimizing a four-factor virtual catapult to shoot a specific length.
Download the tutorial in English or Danish (Danish-help-spreadsheet).
-
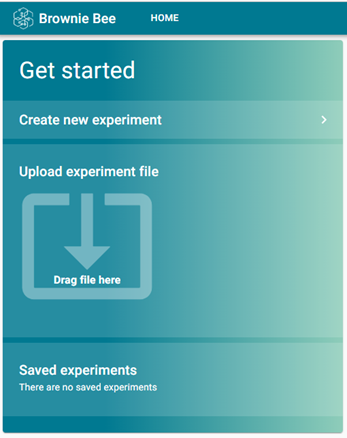
Open Brownie Bee via the website link here https://prod.brownie.projects.alexandra.dk/, where you will see the following landing page. Here you can start setting up a new experiment, upload an experiment file or load one saved in your browser.
-
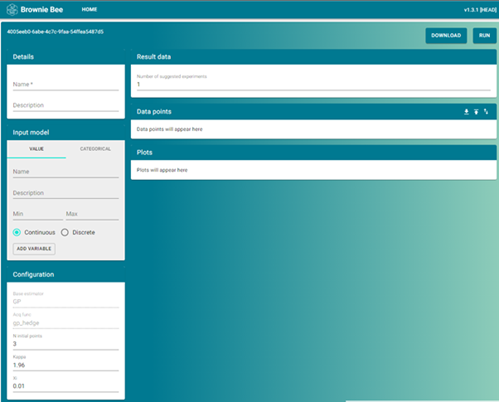
Press “Create new experiment”, which takes you to the tool itself, on a screen that looks like the image below. The exact layout depends on the size of your screen (you can even run Brownie Bee on your phone!).
-
You are now going to run an experiment with a virtual catapult, found here https://sigmazone.com/catapult/.
-
Think of a random number between 100 and 600. Write this down on a piece of paper.
-
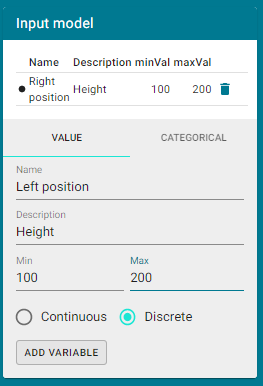
Prepare your experiment by adding factors to your input model, using appropriate names (see example image below). Do this for both positions of the “anchors” of the rubber band, the position of the cup and the angle of the pin, which determines the firing angle. Remember that all of these factors are discrete (you can only set them to whole numbers), but in practice this makes no difference for this system. If you make typos or set the min/max values wrong, delete the factor by clicking the little trash can to the right of the limits.
-
Your goal is now to land a shot as close as possible to the number you noted in step four. Consider how you can define a score that decreases as your shots approach the target, irrespective of the direction of approach.
-
Under “Configuration”, increase “N initial points” to 5. This is the number of experiments that are initially spread across the parameter space and that must be carried out before the model begins to use the results to pick the next, most productive, experiment. The initial points are chosen by a Latin Hypercube sampling and should always be the same for a given system.
-
Change the value of “Xi”, so that it fits your system.
The meaning of Xi is: “The desired improvement, measured from the best observation obtained thus far.”
Xi has the same unit as your score (cm would make sense for this system). It is best to set Xi to some ambitious value to start, as this makes the algorithm explorative, which is what you want at the start of an optimization. You must always adapt Xi to the specific task at hand, otherwise the algorithm is likely to perform very poorly!
-
Once you have chosen an appropriate Xi-value (like 100), press “Run”, in the top right. Brownie Bee will now show you a suggestion for a first experiment to carry out. You can also increase “Number of suggested experiments” to 5 and press “Run” again. This will show you the full list of experiments that must be carried out, before your results are used for anything. Reduce the number of suggested experiments back to 1 before proceeding.
-
You should hopefully have gotten the idea of letting your score be the absolute distance between your shot and your goal, i.e. score = abs(shot length – goal). We suggest opening a spreadsheet and preparing a column that calculates scores for each shot automatically for the rest of this tutorial (you will be making something like 15-25 shots).
-
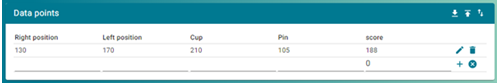
Carry out the experiments suggested by Brownie Bee one at a time. When you shoot, pull the lever as far back as it can go each time. After each shot, enter the catapult settings that you used, along with the score that resulted from the shot. As an example, imagine your goal was 407 cm, and the first suggestion was the settings [130/170/210/105] for right, left, cup and pin positions, respectively. This results in a shot of 219 cm, and a score of 188 (the difference between goal and shot in cm). Enter these values in the blank line under “Data points” and press the + icon to add the result. Afterwards, the table should look like this:
-
You can edit this experiment if you made a mistake by pressing the small pencil icon. The whole data table can be downloaded as a .csv-file by pressing the small downward facing arrow in the top right. You can also upload data from a csv.-file, provided it follows the same formatting.
-
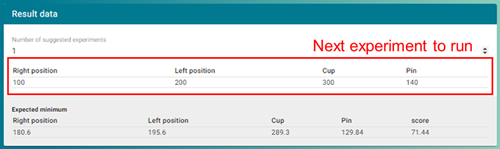
Press “Run” to get a new suggestion, carry out this experiment and continue this process until you have completed the fifth experiment. Double check that “Number of suggested experiments” is set to 1, then press “Run”. This makes several plots appear below the data table, as Brownie Bee has now started modelling the data and uses this model to pick the next suggested experiment. Brownie Bee also shows you the expected minimum of the model but be aware that this location and its value is very uncertain when you have few data points. Make sure to distinguish between the next experiment that Brownie Bee suggests that you carry out, and the displayed expected minimum (see below):
-
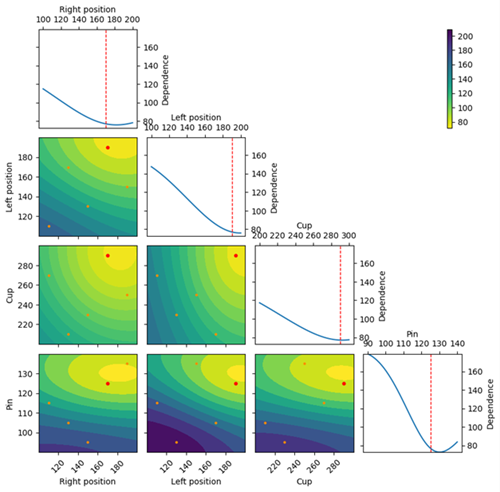
The objective plot (shown below) plots the present model of the system as it appears at the best observation made thus far. The diagonal plots show the model plotted along each individual factor, while the colored fields illustrate the model values across all pairs of factors in the model. E.g. the top left colored plot shows how the model believes the score changes as a function of left position and right position, while all other factors are set to those of the best observation made until now. At this stage, you can see that the model believes a minimum exists at slightly larger values of the right position and pin angle, when considering the system from the best shot obtained among the first five data points. This plot is likely to change quite a lot as data gets added to the model in the early phase of your experiment.
-
Continue the optimization until you obtain a shot within 15-25 cm of your target. Press “Run” while your Xi-value is still large, note down the suggested next experiment, then change Xi to a very low value (1-5) and press Run again. Depending on your data coverage, you should experience that the next suggested experiment lies close to either the best observation in the data set, or the “Expected minimum” settings. Carry out the suggested experiment and consider if you think the optimization is complete (try making a few shots without changing anything on the catapult, to get a feeling for the noise in your system).
-
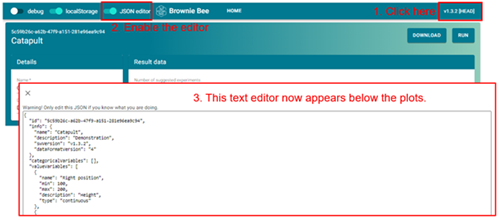
The whole experiment (input model, configuration and data) can be saved to your computer by pressing “Download” in the top right. This sends a .json file to your computer (you can open it with a text editor), which can be reloaded into Brownie Bee on the landing page (step 1). You can also edit the file directly (and change the factor limits for instance), by clicking on the version number above the “Run” button, which exposes the option to show an editor on the website, see below. Do note that it is very easy to break the experiment by making edits in this if you are not careful though!